What Is Beta in Stocks?
Beta measures how much a stock moves relative to the market. What the numbers mean, and why it is a measure of volatility rather than risk.
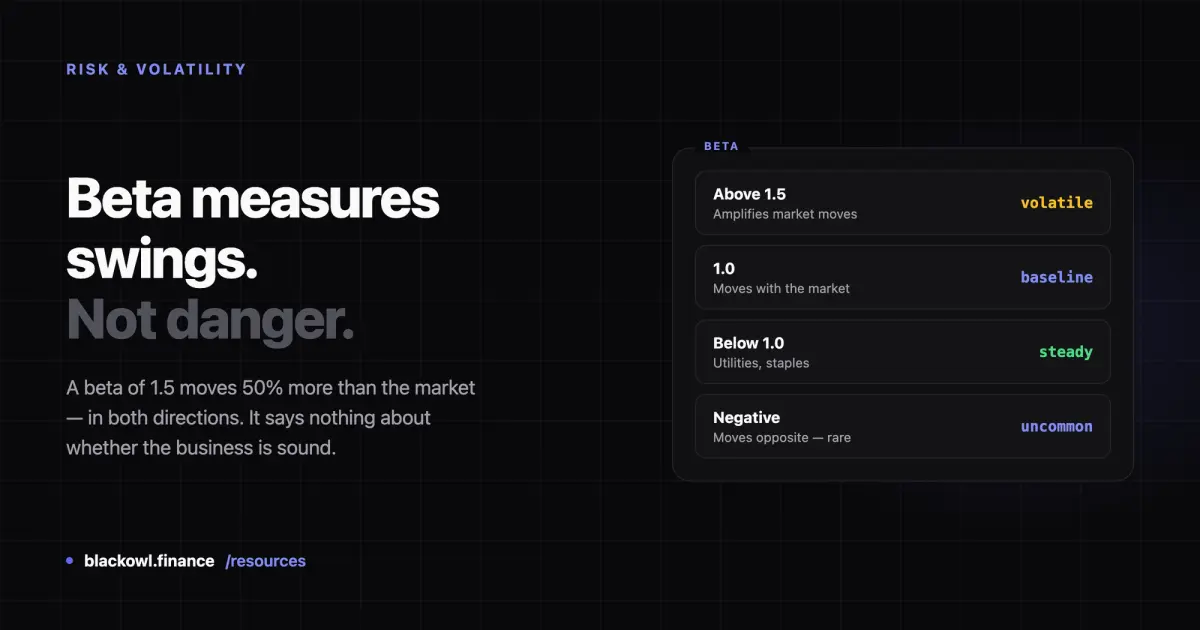
Beta measures how much a stock's price moves relative to the market as a whole. A beta of 1.0 means the stock has historically moved in line with the market; 1.5 means it tends to move 50% more in both directions; 0.5 means it moves half as much. The market itself, usually the S&P 500, has a beta of exactly 1.0 by definition.
It is the standard measure of a stock's volatility — which is not the same thing as its risk.
How beta is calculated
Beta comes from a regression of the stock's returns against the market's:
Beta = Covariance(stock returns, market returns) ÷ Variance(market returns)
In practice nobody computes it by hand — it is published by every data provider. What matters is knowing what went into it, because the inputs vary and so do the results.
The period. Most providers use 3 or 5 years of monthly returns. Some use 1 year of daily returns. A stock's beta over the pandemic crash differs sharply from its beta over a calm stretch.
The benchmark. Usually the S&P 500 for US stocks, but a provider might use a total-market or sector index instead.
This is why two sites report different betas for the same company. Before comparing figures across sources, check they use the same period and benchmark. Blackowl's Key Statistics shows the figure supplied by its data provider.
Reading the number
| Beta | Interpretation |
|---|---|
| Above 1.5 | Substantially more volatile than the market |
| 1.0 – 1.5 | Moves with the market, somewhat amplified |
| Exactly 1.0 | Moves in line with the market |
| 0 – 1.0 | Less volatile; typical of utilities and staples |
| Around 0 | Little relationship to market movements |
| Negative | Tends to move opposite the market — rare |
Beta cuts both ways. A beta of 1.5 does not mean a stock outperforms. In a market that falls 10%, that stock has historically fallen about 15%. Amplification is symmetrical, and this is the most common misreading of the number.
High-beta names cluster in technology, semiconductors and small caps. Low-beta names cluster in utilities, consumer staples and healthcare — businesses whose demand does not track the economic cycle.
Negative beta is genuinely uncommon. Gold miners sometimes approach it during equity selloffs, but few stocks sustain it.
Volatility is not risk
This is the distinction that matters, and it is where beta is most often misused.
Beta describes how much a price has swung relative to the market. It says nothing about whether the business is sound. A company with stable earnings, no debt and a strong position can have a high beta simply because its shares trade actively. A declining business heading toward insolvency can have a low beta right up until the moment it fails.
Beta is silent on everything that determines whether you lose money permanently:
- the balance sheet — see how free cash flow tests whether earnings are real
- valuation — a low-beta stock bought at a high P/E ratio can still fall hard
- competitive position, management, regulation
For a long-term holder, volatility is mostly noise. For someone who may need to sell at a fixed date, it is a real constraint. Whether beta matters depends on your holding period, not on the number.
Beta is worth reading last, not first — after you understand the business and its numbers. That order is the subject of how to research stocks.
Where beta misleads
It is entirely backward-looking. Beta is calculated from past returns. A company that has just changed materially — a large acquisition, a new capital structure, a shift in its core market — has a beta describing a business that no longer exists.
It is unstable. Recalculated over a different window, the same stock can show a materially different beta. Treat it as approximate, not precise.
It assumes a linear relationship. Beta fits a straight line through past returns. Real markets have periods when correlations break down entirely — often exactly when it matters most.
It ignores company-specific risk. Beta captures only the portion of movement explained by the market. A pending lawsuit or a failed drug trial does not show up in it at all.
Low beta is not safety. A stock can be persistently low-beta and still lose most of its value. Beta measures the relationship to the market, not the direction of travel.
See beta on real companies
Key Statistics on each stock page shows Beta alongside the valuation and profitability figures:
Compare a semiconductor name against a large-cap software name. The gap reflects how each business's fortunes track the economic cycle — it is not a judgement about which is better run.
Sources
- U.S. SEC (investor.gov) — Stocks: how investors earn returns
- FINRA — Stocks
Frequently asked questions
What is a good beta for a stock?
There is no universally good beta — it depends on your holding period and what else you own. A beta near 1.0 means the stock moves roughly with the market. Below 1.0 suits investors who want smaller swings; above 1.0 means larger moves in both directions, not better returns. Beta describes volatility, not quality, so it should never be read as a measure of whether a business is sound.
Is a high beta stock riskier?
More volatile, which is not the same as riskier. A high-beta stock swings more than the market in both directions, but beta says nothing about debt, valuation or competitive position — the things that cause permanent losses. A low-beta company in structural decline can lose far more of your money than a high-beta company with strong fundamentals.
Why do different websites show different betas for the same stock?
Because there is no single convention. Providers use different periods — commonly 3 or 5 years of monthly returns, sometimes 1 year of daily returns — and different benchmark indices. Both choices change the result. Always check the period and benchmark before comparing beta figures across sources.
Related Articles

What Is the P/E Ratio?
The P/E ratio is share price divided by earnings per share. How to calculate it, trailing vs forward, and what it can and cannot tell you.

What Is Free Cash Flow?
Free cash flow is the cash a business generates after paying to maintain and grow its asset base. Why it is harder to fake than earnings.

How to Research Stocks
A practical order for researching a stock: what the business does, whether it makes money, whether the profit is real, and what you are paying for it.
Invest Smarter with Blackowl
Blackowl is your AI-powered financial copilot, helping you track, analyze, and optimize your investments with ease.
- AI-powered insights
- Portfolio tracking
- Dividend management
- Performance analytics