How to Research Stocks
A practical order for researching a stock: what the business does, whether it makes money, whether the profit is real, and what you are paying for it.

Researching a stock means answering four questions in order: what does the business do, does it make money, is that profit real, and what are you paying for it. Most people start with the last one — the valuation — which is why so much stock research produces confident conclusions from thin evidence.
This page walks the sequence, and links to a detailed explainer for each metric.
Step 1 — Understand the business first
Before any number, be able to say in one sentence how the company makes money. Who pays it, for what, and why do they choose it over the alternative?
If you cannot answer that, no ratio will help. A P/E of 12 means nothing if you do not know whether the business is a declining newspaper chain or a stable utility.
Read the company's own annual report — the 10-K — rather than a summary of it. The business description and risk factors sections are written under legal liability, which makes them unusually honest compared with marketing material.
What to establish: the product, the customer, the competition, and what would have to go wrong for the business to shrink.
Step 2 — Check that it makes money
Now the profitability figures. Three, in rough order of usefulness:
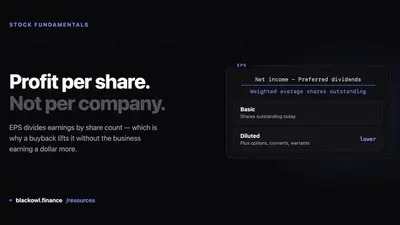
Earnings per share — profit divided by shares outstanding. Watch the trend over several years rather than the level, and check whether share count is falling, because buybacks raise EPS without the business earning any more.
Profit margin — what share of each sales dollar the company keeps. Compare only within an industry: a 2% margin is normal for a grocer and alarming for software.
Return on equity — profit relative to shareholder capital. It answers whether the company uses money well, which margin alone does not. See what is a good ROE — and why debt can fake one.
Beta — how much the share price swings relative to the market. Worth knowing, but it measures volatility, not whether the business is sound.The most informative pattern here is direction. Margins expanding over five years suggests pricing power; contracting suggests competition.
Step 3 — Check the profit is real
This step is the one most often skipped, and it is where the largest mistakes live.
Reported earnings are an accounting figure. They are shaped by depreciation schedules, one-off items and legitimate judgement calls. Cash is much harder to manufacture.
Free cash flow is the cash left after the company pays to maintain and grow its asset base. Compare it to net income: if a company consistently reports profits that do not convert into cash, ask why. That single comparison catches a large share of businesses whose numbers look better than the reality.
If the company pays a dividend, check that dividend yield against cash flow too. A payout that earnings cover but cash does not is a payout at risk.
Step 4 — Work out what you are paying
Only now, valuation. A great business at a bad price is a bad investment.
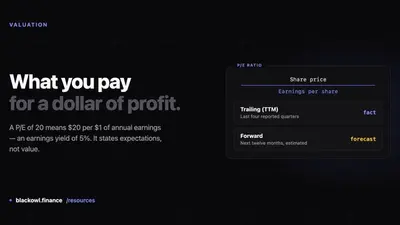
The P/E ratio — price divided by earnings per share. The standard starting point, and the one most often misread. It tells you what the market expects, not whether something is cheap.
What counts as a good P/E depends on sector, growth rate and interest rates. The key thing to internalise is that a low P/E is frequently a warning rather than a bargain — markets mark businesses down for reasons.
The PEG ratio divides P/E by the growth rate, which puts fast and slow growers on comparable footing. Useful as a filter, though it inherits all the uncertainty of whatever growth forecast it uses.
Step 5 — Look for what would prove you wrong
Research that only confirms an existing view is not research. Before deciding, write down what would change your mind: a margin falling below some level, a competitor winning share, a debt covenant tightening.
Then check the balance sheet, which every metric above ignores. Two companies with identical earnings are not equivalent if one carries three times the debt. Leverage is what turns a difficult year into a permanent loss.
A realistic checklist
- Can I explain the business in one sentence?
- Are revenue and earnings growing over five years, not just one?
- Do margins hold up against direct competitors?
- Does reported profit convert into cash?
- How much debt, and when does it mature?
- What am I paying relative to earnings and growth?
- What would make me sell?
Anything unanswered is a gap in the research, not a detail to fill in later.
Apply it to a real company
Each stock page shows the figures above in Key Statistics — P/E, forward P/E, EPS, dividend yield and return measures — in one place:
Work through one company end to end. The sequence matters more than the speed.
Sources
- U.S. SEC (investor.gov) — Stocks: how investors earn returns
- FINRA — Stocks
Frequently asked questions
Where should a beginner start researching a stock?
Start with the business, not the numbers. Be able to explain in one sentence how the company makes money, who its customers are, and why they choose it over competitors. Ratios only become meaningful once you understand what the business actually does — a P/E of 12 tells you nothing if you do not know whether you are looking at a declining industry or a stable one.
What financial metrics matter most?
For most companies, four cover the essentials: earnings per share and its trend, profit margin compared within the industry, free cash flow to confirm reported profit becomes real cash, and the P/E ratio to see what you are paying. Debt levels matter alongside all of them, because leverage is what turns a bad year into a permanent loss.
How long does researching a stock take?
A first pass through the business model, several years of financials and the valuation typically takes a few hours per company. That is the realistic figure. Reading a summary and checking one ratio takes ten minutes and is not research — most of the value comes from the steps people skip, particularly checking that reported earnings convert into cash.
Related Articles
What Is the P/E Ratio?
The P/E ratio is share price divided by earnings per share. How to calculate it, trailing vs forward, and what it can and cannot tell you.
What Is EPS? Earnings Per Share Explained
EPS is a company's profit divided by its shares outstanding. What it measures, how to read it, and where it misleads.

What Is Beta in Stocks?
Beta measures how much a stock moves relative to the market. What the numbers mean, and why it is a measure of volatility rather than risk.
Invest Smarter with Blackowl
Blackowl is your AI-powered financial copilot, helping you track, analyze, and optimize your investments with ease.
- AI-powered insights
- Portfolio tracking
- Dividend management
- Performance analytics