What Is EPS? Earnings Per Share Explained
EPS is a company's profit divided by its shares outstanding. What it measures, how to read it, and where it misleads.
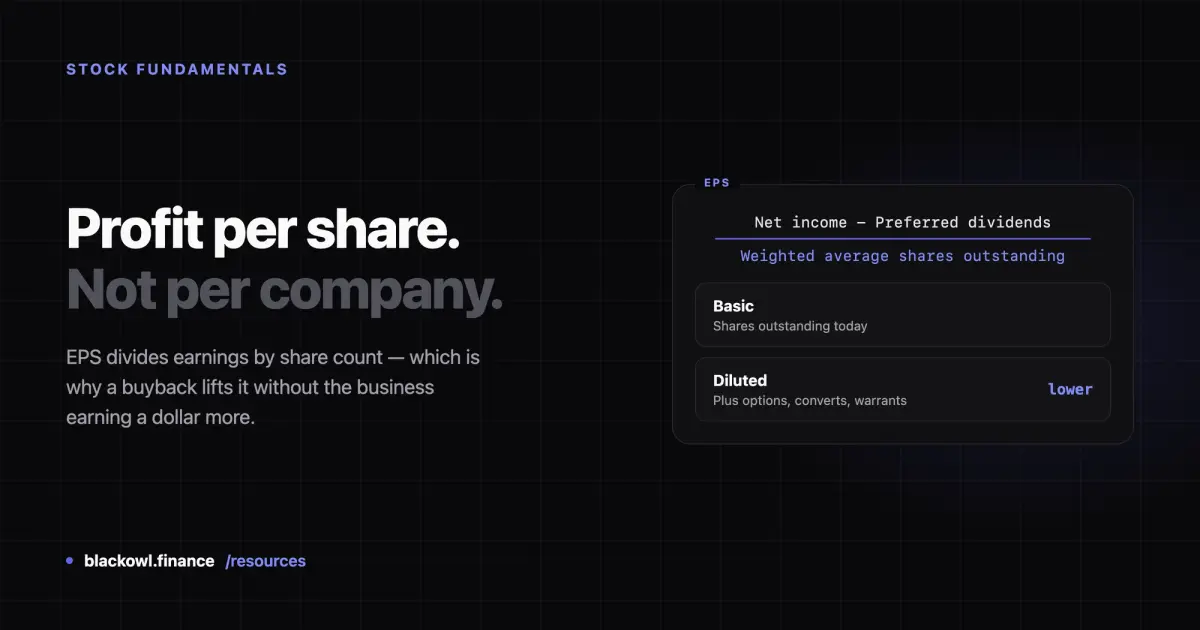
EPS, or earnings per share, is a company's net profit divided by the number of shares outstanding. It tells you how much profit the business generated for each share you own. A company earning $10 billion with 2 billion shares has an EPS of $5.
It is the most widely quoted number in equity analysis, and the denominator of the P/E ratio — which is why it shows up everywhere.
How EPS is calculated
The basic formula:
EPS = (Net income − Preferred dividends) ÷ Weighted average shares outstanding
Preferred dividends come out first because that profit belongs to preferred shareholders, not common ones. Shares are weighted by how long they were outstanding during the period, so a buyback halfway through the year only counts for half the year.
A worked example. A company reports $12 billion in net income, pays no preferred dividends, and averaged 4 billion shares:
$12,000,000,000 ÷ 4,000,000,000 = $3.00 EPS
Basic vs diluted EPS
You will usually see two figures. Basic EPS uses shares outstanding today. Diluted EPS also counts everything that could become a share — employee stock options, convertible bonds, warrants.
Diluted EPS is always the lower of the two, and it is the more conservative number. For companies that pay staff heavily in stock, the gap matters: it is the difference between profit per share today and profit per share once those options vest. Use diluted EPS unless you have a specific reason not to.
Trailing vs forward EPS
Trailing EPS (TTM) sums the last four reported quarters. It is a fact.
Forward EPS is analysts' estimate for the next four quarters. It is a forecast, and forecasts are wrong regularly. When a stock screener shows a suspiciously low P/E, check whether it is using forward EPS built on optimistic estimates.
What is a good EPS?
There is no universal threshold, and any article giving you one is guessing. EPS is denominated in dollars per share, and share count is an arbitrary decision a company makes — a 2-for-1 stock split halves EPS overnight without changing the business at all.
That makes raw EPS useless for comparing two different companies. A $2 EPS is not "worse" than a $20 EPS.
What EPS is genuinely good for:
- Growth over time in the same company. EPS rising 15% a year for five years tells you something real.
- Against expectations. "Beat by $0.04" moves stock prices because it updates the market's forecast.
- As the input to P/E, which normalises for price and is comparable across companies.
So the useful question is not "is this EPS good" but "is it growing, and did it beat what the market expected?"
Where EPS misleads
Four failure modes worth knowing:
Buybacks flatter it. EPS is a fraction. Shrinking the denominator raises EPS without earning an extra dollar. A company buying back 5% of its shares posts ~5% EPS growth on flat profits. Check whether share count is falling before crediting management with growth.
One-off items distort it. Selling a building, winning a lawsuit, or writing down an acquisition all land in net income. A quarter can look excellent because of something that will never repeat. This is why analysts track "adjusted" EPS — though companies choose their own adjustments, so treat those with care.
It ignores the balance sheet. Two companies with identical EPS are not equivalent if one carries heavy debt. EPS says nothing about leverage, and a highly-indebted company's earnings are far more fragile.
Accounting profit is not cash. Net income includes non-cash charges like depreciation and can be shaped by accounting choices. A company can post positive EPS while burning cash. This is why free cash flow is worth reading alongside it.
See EPS on real companies
Every stock page on Blackowl shows EPS (TTM) in Key Statistics, alongside the P/E ratio it feeds:
Compare EPS against the share count trend on the same page. Where EPS is rising and shares outstanding are falling, part of that growth is the buyback, not the business.
Sources
- U.S. SEC (investor.gov) —
- FINRA — Understanding Financial Statements
Frequently asked questions
What is a good EPS?
There is no universal "good" EPS, because the figure depends on how many shares a company has issued — an arbitrary choice. A stock split halves EPS without changing the business. EPS is useful for tracking growth within one company over time, or against analyst expectations, but not for comparing two different companies. For that, use the P/E ratio, which accounts for price.
What is the difference between basic and diluted EPS?
Basic EPS divides profit by shares outstanding today. Diluted EPS also includes shares that could be created from stock options, convertible bonds and warrants. Diluted EPS is always lower and is the more conservative figure. It matters most for companies that pay employees heavily in stock.
Can a company have negative EPS?
Yes. Negative EPS means the company lost money over the period. This is common for early-stage and high-growth companies investing ahead of profitability. A negative EPS also makes the P/E ratio meaningless, which is why screeners often show no P/E for unprofitable companies.
Related Articles

What Is the P/E Ratio?
The P/E ratio is share price divided by earnings per share. How to calculate it, trailing vs forward, and what it can and cannot tell you.

What Is Free Cash Flow?
Free cash flow is the cash a business generates after paying to maintain and grow its asset base. Why it is harder to fake than earnings.

How to Research Stocks
A practical order for researching a stock: what the business does, whether it makes money, whether the profit is real, and what you are paying for it.
Invest Smarter with Blackowl
Blackowl is your AI-powered financial copilot, helping you track, analyze, and optimize your investments with ease.
- AI-powered insights
- Portfolio tracking
- Dividend management
- Performance analytics