What Is Free Cash Flow?
Free cash flow is the cash a business generates after paying to maintain and grow its asset base. Why it is harder to fake than earnings.
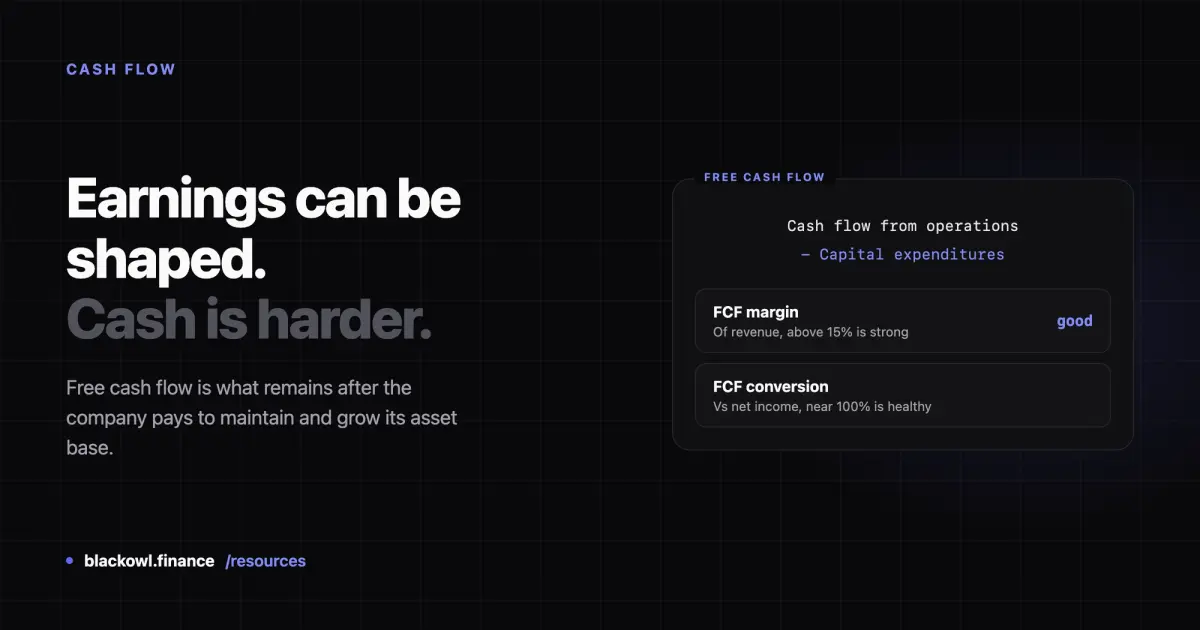
Free cash flow (FCF) is the cash a company generates from operations after subtracting what it spends on property, equipment and other capital assets. It is the money genuinely available to pay dividends, buy back shares, repay debt, or reinvest — cash that is actually in the bank, not accounting profit.
It matters because EPS can be shaped by accounting choices. Cash is much harder to manufacture.
How free cash flow is calculated
The standard formula:
FCF = Cash flow from operations − Capital expenditures
Both figures come straight off the cash flow statement, which is why FCF is harder to massage than earnings.
A worked example. A company reports $8 billion in operating cash flow and spends $3 billion on capital expenditure:
$8,000,000,000 − $3,000,000,000 = $5 billion FCF
That $5 billion is what the business actually produced for its owners that year.
Why it differs from net income
Net income and cash flow diverge for structural reasons, not just accounting games:
- Depreciation reduces net income but costs no cash in the current period.
- Working capital swings — a company that ships product but has not been paid yet books revenue while cash sits in receivables.
- Capital expenditure consumes cash immediately but hits earnings slowly, spread over years of depreciation.
A capital-intensive business can post healthy earnings and negative free cash flow for years. A software business often does the reverse.
Maintenance vs growth capex
Capital expenditure blends two very different things: spending to keep existing operations running, and spending to expand. FCF subtracts both.
That means a company investing aggressively in future growth can look poor on FCF while doing exactly the right thing. Companies rarely disclose the split between the two, so read a low FCF number alongside what the business is actually building.
What is a good free cash flow?
As with EPS, the absolute dollar figure means little on its own — a $500 million FCF is excellent for a mid-cap and unremarkable for a giant. Three normalised views are more useful:
FCF margin (FCF ÷ revenue) shows how much of each sales dollar becomes cash. Above 15% is typically strong; software businesses often exceed 25%, while retail and airlines run in low single digits. Compare within a sector.
FCF yield (FCF ÷ market cap) is the cash return on the price you pay, and works as a valuation check alongside the P/E ratio. A 5% FCF yield means the business throws off $5 in cash annually per $100 of market value.
FCF conversion (FCF ÷ net income) tests whether reported profit becomes real cash. Consistently near or above 100% is a quality signal. Persistently below — say 60% — is worth investigating: earnings are being reported that cash is not backing.
The most informative pattern is the trend. FCF growing steadily over five years says more than any single year's figure.
Where free cash flow misleads
It is lumpy by nature. A single large factory or acquisition can crush FCF in one year with no bearing on the underlying business. Read several years, not one.
It can be flattered by underinvestment. A company can boost FCF simply by not maintaining its assets. That works briefly and damages the business later. Rising FCF alongside falling capex over several years deserves scrutiny, not applause.
Working capital games shift it between periods. Delaying supplier payments to the far side of year-end lifts this year's FCF and depresses next year's. Nothing improved.
Definitions vary. Some sources subtract only maintenance capex; others adjust for stock-based compensation, acquisitions or leases. Two websites can report materially different FCF for the same company. Check the definition before comparing.
Negative is not automatically bad. Early-stage and heavily-reinvesting companies routinely run negative FCF. The question is whether the spending is building something.
See the inputs on real companies
Key Statistics on each stock page shows the profitability and valuation figures that sit alongside cash flow:
Read EPS against the cash flow statement in the company's own filings. Where reported earnings are strong but cash conversion is weak, the gap is the thing worth understanding.
Sources
- U.S. SEC (investor.gov) — How to Read a 10-K/10-Q — where the statement of cash flows sits in a filing
- FINRA — Stocks
Frequently asked questions
What is a good free cash flow margin?
An FCF margin above 15% of revenue is generally strong, but it varies enormously by industry. Software and asset-light businesses often exceed 25%, while airlines, retailers and manufacturers operate on low single digits because they need heavy ongoing capital investment. Compare a company to its own sector and its own history rather than to a universal threshold.
Is free cash flow better than net income?
They answer different questions. Net income measures accounting profit under standard rules; free cash flow measures the cash actually left after capital spending. FCF is harder to manipulate, which makes it valuable as a cross-check. The ratio between the two — FCF conversion — is often more revealing than either figure alone.
Is negative free cash flow always bad?
No. Negative FCF is normal for young or rapidly expanding companies investing ahead of returns, and for capital-intensive businesses in a build phase. What matters is why. Negative FCF from building productive capacity is different from negative FCF because operations are losing money. Persistent negative FCF with no growth to show for it is the warning sign.
Related Articles
What Is EPS? Earnings Per Share Explained
EPS is a company's profit divided by its shares outstanding. What it measures, how to read it, and where it misleads.
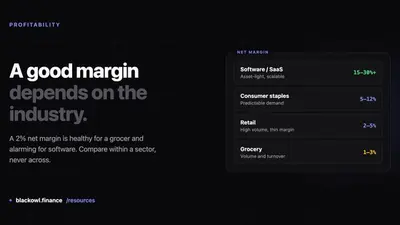
What Is a Good Profit Margin?
A good profit margin depends almost entirely on the industry. The three margins that matter, typical ranges, and what they reveal.

How to Research Stocks
A practical order for researching a stock: what the business does, whether it makes money, whether the profit is real, and what you are paying for it.
Invest Smarter with Blackowl
Blackowl is your AI-powered financial copilot, helping you track, analyze, and optimize your investments with ease.
- AI-powered insights
- Portfolio tracking
- Dividend management
- Performance analytics