What Is a Good P/E Ratio?
There is no single good P/E. What the ranges actually mean, why they differ by sector, and when a low P/E is a trap.
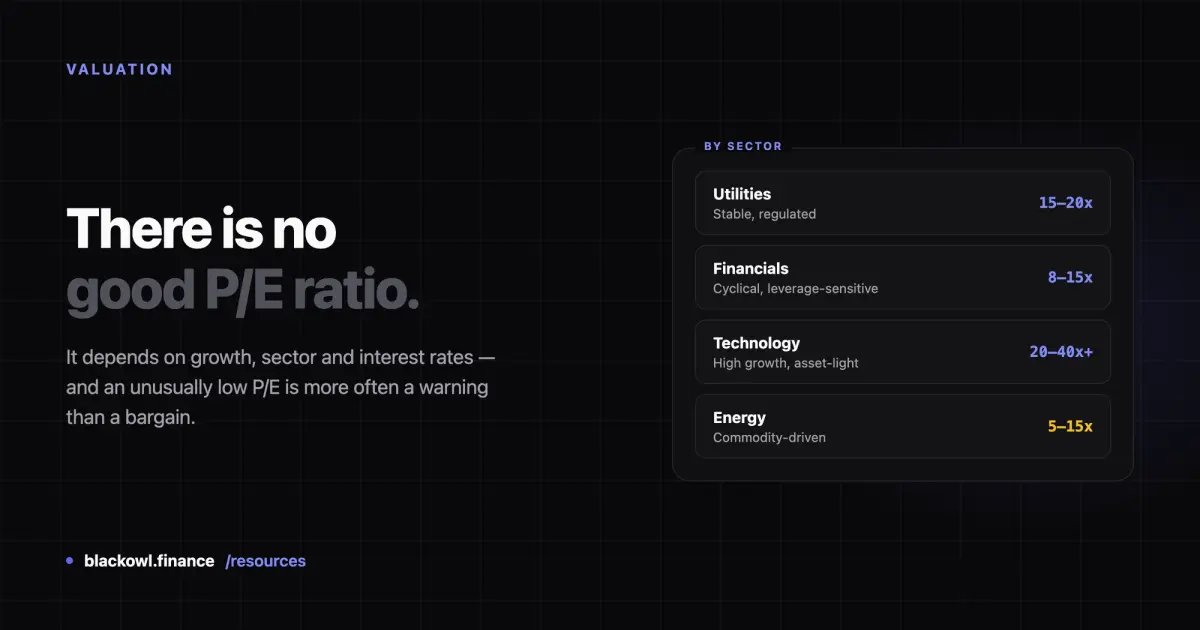
There is no single good P/E ratio. As a rough anchor, the S&P 500 has historically averaged somewhere around 15–20x, so a P/E in that range is unremarkable. But a "good" P/E depends entirely on the company's growth rate, its sector, and where interest rates sit — and a low P/E is often a warning rather than a bargain.
If you want the mechanics of the ratio itself, start with what a P/E ratio is. This page is about how to judge one.## Why there is no universal answer
P/E is price divided by earnings per share. It tells you what the market is paying for each dollar of current profit. That number embeds an expectation about the future, which is why identical P/Es can mean opposite things.
A utility trading at 18x and a software company trading at 18x are not equivalently valued. The utility's earnings are stable and slow-growing; the software company's may double or collapse. The market is making very different bets at the same price.
Three things move what counts as reasonable:
Growth rate. A company growing earnings 30% a year justifies a higher multiple than one growing 3%. This is the whole idea behind the PEG ratio, which divides P/E by the growth rate to make the comparison fairer.
Interest rates. When safe bonds yield 5%, investors demand more from equities, and multiples compress. When rates are near zero, the same earnings support a much higher price. A P/E that looked expensive in 2007 and cheap in 2021 may not reflect any change in the business.
Sector economics. Capital-intensive, cyclical, and regulated industries structurally trade lower. Asset-light businesses with recurring revenue trade higher. That is a permanent structural feature, not a mispricing.
Rough sector ranges
Treat these as orientation, not thresholds. They shift with the rate environment.
| Sector | Typical range | Why |
|---|---|---|
| Utilities | 15–20x | Stable, regulated, slow growth |
| Consumer staples | 18–25x | Predictable demand, modest growth |
| Financials | 8–15x | Cyclical, leverage-sensitive |
| Energy | 5–15x | Commodity-driven, highly cyclical |
| Industrials | 15–25x | Tracks the economic cycle |
| Healthcare | 15–30x | Wide range: pharma vs biotech differ enormously |
| Technology | 20–40x+ | High growth, asset-light, scalable |
Compare a company to its own sector and its own history, not to a single market-wide number. A bank at 25x and a software company at 25x are telling you very different things.
When a low P/E is a trap
The most expensive mistake in this area is treating a low P/E as automatically cheap. Markets price businesses low for reasons, and the reasons are usually visible:
The value trap. A structurally declining business — print media, mall retail, some legacy hardware — can trade at 8x for years while earnings shrink underneath. The multiple never re-rates because the E keeps falling. Cheap on today's earnings, expensive on tomorrow's.
Peak cyclical earnings. Cyclical companies look cheapest at the top of their cycle, when earnings are at maximum. A miner at 6x after a commodity spike is often more dangerous than the same miner at 20x after a trough. For cyclicals, a low P/E can be a sell signal.
One-off profits. An asset sale or legal win inflates E for one year, mechanically deflating P/E. The business has not changed.
Real distress. Sometimes low is correct: debt problems, a lost patent, litigation, or a broken competitive position.
The reverse also holds. A high P/E is not automatically expensive — if a company genuinely compounds earnings at 30%, a 40x multiple can be reasonable. The risk is that it doesn't, and high-multiple stocks fall hard when growth disappoints.
How to use it properly
P/E is a starting question, not a conclusion. A workable sequence:
- Compare to the company's own history. Is it above or below its 5-year average, and has anything changed to justify that?
- Compare to close competitors, not the whole market.
- Adjust for growth with the PEG ratio.
- Check the E is real — look at free cash flow and whether earnings are inflated by one-offs.
- Check the balance sheet. Two identical P/Es are not equivalent if one carries far more debt.
See P/E on real companies
Key Statistics on each stock page shows both trailing and forward P/E:
Compare the tech names against each other rather than against the market average — the gap between forward and trailing P/E tells you what growth the market is expecting.
Sources
- U.S. SEC (investor.gov) —
- FINRA — Stocks
Frequently asked questions
Is a P/E of 15 good?
A P/E around 15 is close to the long-run S&P 500 average, so it is unremarkable rather than good or bad on its own. Whether it is attractive depends on the company's growth rate and sector. For a fast-growing software company, 15x could be genuinely cheap. For a declining business with shrinking earnings, it could still be expensive.
Is a low P/E always better?
No. A low P/E often signals a problem the market has already identified — a structurally declining business, peak cyclical earnings, or financial distress. This is called a value trap. Cyclical companies in particular look cheapest at the top of their cycle, when earnings are at a maximum and about to fall.
What P/E is too high?
There is no fixed ceiling. A high multiple is justified if the company grows into it. The practical test is the PEG ratio, which divides P/E by the earnings growth rate — that puts fast and slow growers on comparable footing. The real risk with high-multiple stocks is that they fall sharply when growth disappoints.
Related Articles
What Is the P/E Ratio?
The P/E ratio is share price divided by earnings per share. How to calculate it, trailing vs forward, and what it can and cannot tell you.
What Is the PEG Ratio?
PEG divides the P/E ratio by earnings growth, so fast and slow growers can be compared fairly. How to read it and where it breaks.

How to Research Stocks
A practical order for researching a stock: what the business does, whether it makes money, whether the profit is real, and what you are paying for it.
Invest Smarter with Blackowl
Blackowl is your AI-powered financial copilot, helping you track, analyze, and optimize your investments with ease.
- AI-powered insights
- Portfolio tracking
- Dividend management
- Performance analytics