What Is the PEG Ratio?
PEG divides the P/E ratio by earnings growth, so fast and slow growers can be compared fairly. How to read it and where it breaks.
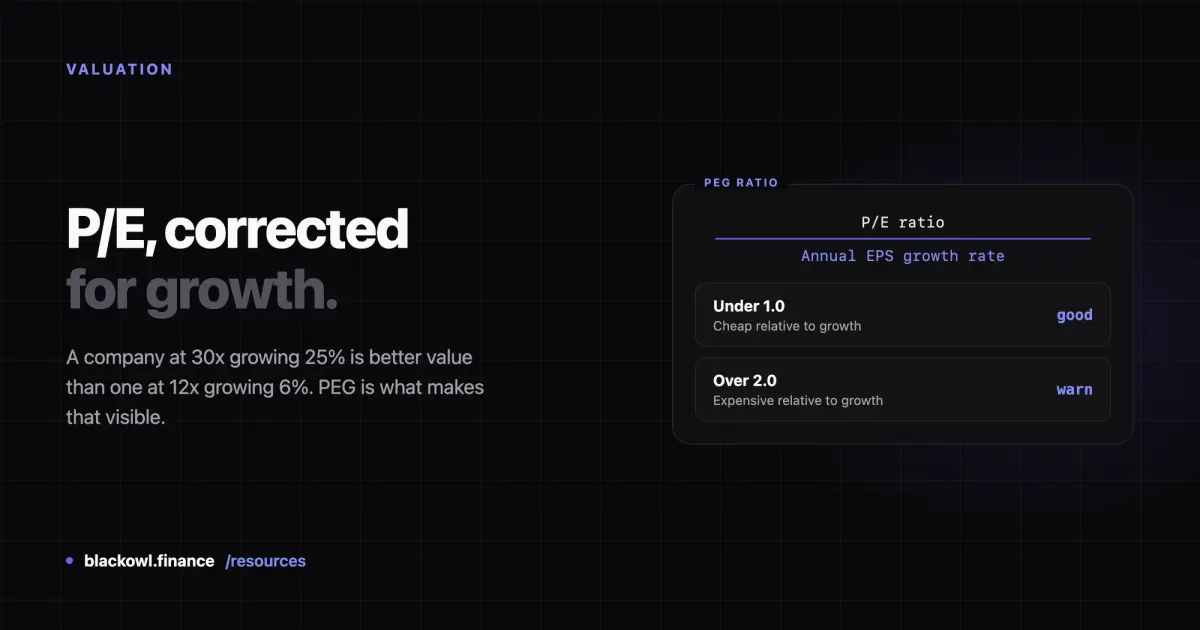
The PEG ratio is a company's P/E ratio divided by its earnings growth rate. It exists because P/E alone punishes fast-growing companies: a business growing 40% a year will always look expensive next to one growing 4%. PEG puts them on comparable footing.
A PEG of 1.0 is the traditional rule of thumb for fair value — a company growing 20% a year trading at 20x earnings.
How PEG is calculated
PEG = P/E ratio ÷ Annual EPS growth rate
The growth rate goes in as a plain number, not a decimal: 20% growth is 20, not 0.20.
A worked example. A company trades at 30x earnings and is expected to grow EPS 25% a year:
30 ÷ 25 = PEG of 1.2
Compare that to a company at 12x growing 6% a year:
12 ÷ 6 = PEG of 2.0
On P/E alone the second company looks far cheaper — 12x versus 30x. On PEG, the first is better value, because you are paying less per unit of growth. That inversion is the entire point of the ratio.
Which growth rate?
This is where PEG gets slippery. There is no single convention:
- Forward PEG uses analysts' projected growth, often the 5-year estimate. Most common, and entirely dependent on forecasts.
- Trailing PEG uses historical growth. Factual, but assumes the past continues.
Two data providers can show completely different PEG values for the same company because they chose different growth inputs. Always check which one you are looking at, and never compare a forward PEG from one source to a trailing PEG from another.
What is a good PEG ratio?
The conventional reading, popularised by Peter Lynch:
| PEG | Traditional interpretation |
|---|---|
| Under 1.0 | Potentially undervalued relative to growth |
| Around 1.0 | Fairly valued |
| Over 2.0 | Expensive relative to growth |
Treat this as a screening heuristic, not a valuation. Three caveats matter more than the thresholds:
Sub-1.0 PEGs are usually telling you the growth forecast is not believed. If a company genuinely trades at 10x while compounding 20%, the market has typically priced in doubt — cyclical peak earnings, a one-off boost, or competitive pressure. A low PEG is a prompt to investigate the growth assumption, not a buy signal.
The rule of thumb predates the modern rate environment. PEG 1.0 as "fair" emerged when rates were structurally higher. What counts as fair moves with the cost of capital, like every other multiple.
Quality is invisible to PEG. Two companies with identical PEGs are not equivalent if one funds growth with debt and the other with cash flow.
Where PEG breaks
PEG is genuinely useful in a narrow band and misleading outside it:
It is meaningless for negative or near-zero growth. Divide by a negative and you get a negative PEG, which cannot be interpreted. Divide by growth near zero and PEG explodes toward infinity. For flat or declining businesses, PEG tells you nothing — use P/E and cash flow instead.
It inherits everything wrong with the growth forecast. PEG is only as good as its denominator, and 5-year analyst growth estimates are routinely optimistic. A low PEG built on a projection that does not materialise is not a bargain.
It assumes growth is linear. A single annual rate cannot express a company growing 60% next year and 5% after. Lumpy, cyclical, or step-change growth is poorly served.
It ignores the balance sheet and cash conversion. Growth funded by debt looks identical to growth funded internally. Check free cash flow alongside it.
It says nothing about durability. A company growing 30% for two more years and one growing 30% for a decade can show the same PEG today. The difference is most of the value.
How to use it
PEG works best as a filter, not a verdict: it narrows a list of candidates that P/E alone would rank badly, and then you investigate.
A reasonable sequence:
- Check the P/E and whether earnings are real — see what is a good P/E ratio.
- Compute or look up PEG, noting whether it is forward or trailing.
- Interrogate the growth number. Where does it come from? Has the company hit its estimates before?
- Compare PEG within the sector, not across the whole market.
- Confirm the earnings convert to cash.
See the inputs on real companies
Key Statistics on each stock page shows P/E and forward P/E, and EPS — the components PEG is built from:
The gap between trailing and forward P/E on these pages is itself a growth signal: a forward P/E well below the trailing one means the market expects earnings to rise.
Sources
- U.S. SEC (investor.gov) —
- FINRA — Stocks
Frequently asked questions
What is a good PEG ratio?
The traditional rule is that a PEG below 1.0 suggests a company is cheap relative to its growth, and above 2.0 suggests it is expensive. Treat this as a screening heuristic rather than a valuation. A very low PEG usually means the market doubts the growth forecast, so it is a reason to investigate the growth assumption rather than a buy signal.
Is PEG better than the P/E ratio?
Not better — different. PEG adjusts P/E for growth, which makes fast and slow growers comparable, but it inherits all the uncertainty of the growth forecast it uses. PEG is unusable for companies with flat or negative earnings growth, where P/E and cash flow are more informative. Most analysts read both.
Why do different websites show different PEG ratios?
Because there is no standard growth input. Some use forward analyst estimates over five years, others use trailing historical growth, and the estimate horizons vary. The P/E part is consistent; the growth denominator is not. Always check which convention a source uses before comparing PEG figures across sites.
Related Articles
What Is EPS? Earnings Per Share Explained
EPS is a company's profit divided by its shares outstanding. What it measures, how to read it, and where it misleads.
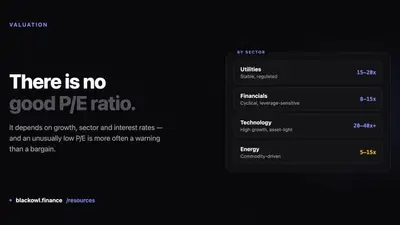
What Is a Good P/E Ratio?
There is no single good P/E. What the ranges actually mean, why they differ by sector, and when a low P/E is a trap.

How to Research Stocks
A practical order for researching a stock: what the business does, whether it makes money, whether the profit is real, and what you are paying for it.
Invest Smarter with Blackowl
Blackowl is your AI-powered financial copilot, helping you track, analyze, and optimize your investments with ease.
- AI-powered insights
- Portfolio tracking
- Dividend management
- Performance analytics