What Is the P/E Ratio?
The P/E ratio is share price divided by earnings per share. How to calculate it, trailing vs forward, and what it can and cannot tell you.
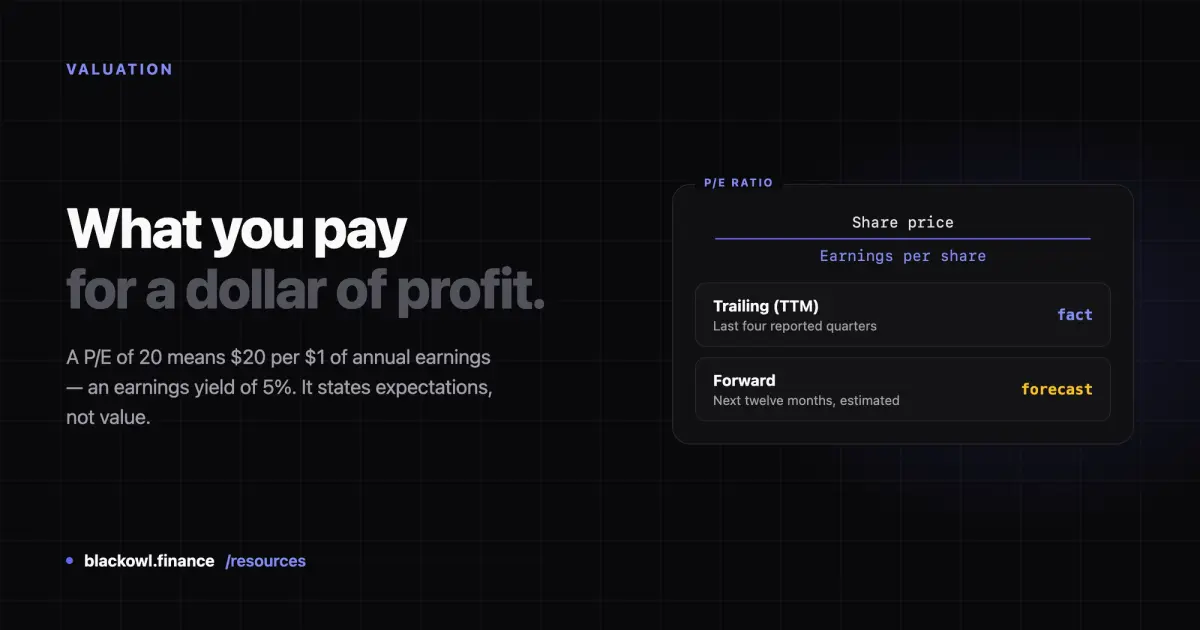
The price-to-earnings ratio, or P/E, is a company's share price divided by its earnings per share. A stock trading at $60 with $3 of annual earnings per share has a P/E of 20. It tells you how many dollars investors are paying for each dollar of the company's annual profit.
It is the most widely used valuation measure in equity investing, largely because it is simple and comparable across companies of very different sizes.
How the P/E ratio is calculated
P/E ratio = Share price ÷ Earnings per share
A worked example. A company trades at $60 per share and reported EPS of $3.00 over the past year:
$60 ÷ $3.00 = P/E of 20
Read it as: investors are paying $20 for every $1 of annual profit. Inverted, it is an earnings yield of 5% — which is a useful way to compare a stock against bond yields.
The same figure can be calculated at the company level: market capitalisation divided by total net income gives the identical result.
Trailing vs forward P/E
Two versions appear everywhere, and they answer different questions:
Trailing P/E (TTM) uses the last four reported quarters of earnings. Based entirely on published results — a fact.
Forward P/E uses analysts' estimated earnings for the next twelve months. More relevant if the estimates prove correct, and estimates are frequently wrong.
For a growing company, forward P/E is lower than trailing, because the denominator is expected to rise. A large gap between the two is itself informative: it tells you how much earnings growth the market expects.
Check which one a site is showing you. Comparing one company's forward P/E to another's trailing P/E is a common and quietly misleading error.
When P/E does not exist
If a company has negative earnings, the P/E is meaningless — you cannot usefully divide by a loss. Screeners typically show a blank or "N/A" rather than a negative number. This is why P/E is unusable for early-stage and unprofitable companies, however promising, and why loss-making sectors get valued on revenue multiples instead.
What the number means
A P/E is a statement about expectations, not a verdict. A high multiple means the market expects earnings to grow; a low one means it does not, or that it doubts the earnings are durable.
Because expectations differ so much by sector and growth rate, there is no single correct level — the question of what counts as a good P/E ratio needs its own treatment, including why an unusually low P/E is frequently a warning rather than a bargain.
The short version: compare a company to its own history and to close competitors, never to a single market-wide average.
Where the P/E ratio misleads
The "E" is an accounting figure. Net income is shaped by depreciation choices, one-off items and tax effects. A quarter flattered by an asset sale mechanically deflates P/E without the business improving. Checking free cash flow tests whether the earnings are real.
Buybacks lower it artificially. P/E is per share. A company repurchasing stock raises EPS and lowers P/E without earning an additional dollar.
It ignores debt entirely. Two companies with the same P/E are not equivalently priced if one is heavily leveraged. Enterprise-value multiples like EV/EBITDA account for this; P/E does not.
It ignores growth. A company growing 30% a year and one growing 3% deserve very different multiples. The PEG ratio exists specifically to correct for that.
Cyclicals invert it. For miners, airlines and chemicals, P/E is lowest at the peak of the cycle, when earnings are at maximum and about to fall. For these businesses a low P/E is often a sell signal rather than a buy one.
Interest rates move it. When safe bonds yield 5%, investors demand more from stocks and multiples compress. The same company can support a much higher P/E in a low-rate environment without anything changing internally.
See the P/E ratio on real companies
Key Statistics on each stock page shows both trailing and forward P/E, alongside the EPS that feeds them:
The gap between the two figures on any of these pages is the market's growth expectation, made explicit.
Sources
- U.S. SEC (investor.gov) — Stocks: how investors earn returns
- FINRA — Stocks
Frequently asked questions
What does a P/E ratio of 20 mean?
A P/E of 20 means investors are paying $20 for every $1 of the company's annual earnings per share. Inverted, that is an earnings yield of 5%. On its own the number is neither good nor bad — it reflects what the market expects future earnings to do, which depends heavily on the company's growth rate and sector.
What is the difference between trailing and forward P/E?
Trailing P/E uses the last four reported quarters of actual earnings, so it is factual. Forward P/E uses analysts' estimates for the coming twelve months, so it is a forecast. For a growing company the forward figure is lower, because earnings are expected to rise. Always check which version a source is showing before comparing two companies.
Why do some stocks have no P/E ratio?
Because the company has negative earnings. Dividing a share price by a loss produces a figure with no useful meaning, so screeners display a blank or "N/A" instead. This is common for early-stage and high-growth companies that are investing ahead of profitability, and it is why unprofitable businesses are usually valued on revenue multiples instead.
Related Articles
What Is a Good P/E Ratio?
There is no single good P/E. What the ranges actually mean, why they differ by sector, and when a low P/E is a trap.

What Is Beta in Stocks?
Beta measures how much a stock moves relative to the market. What the numbers mean, and why it is a measure of volatility rather than risk.

How to Research Stocks
A practical order for researching a stock: what the business does, whether it makes money, whether the profit is real, and what you are paying for it.
Invest Smarter with Blackowl
Blackowl is your AI-powered financial copilot, helping you track, analyze, and optimize your investments with ease.
- AI-powered insights
- Portfolio tracking
- Dividend management
- Performance analytics