What Is a Good ROE?
Return on equity measures profit against shareholder capital. Why 15–20% is the usual benchmark, and why debt can fake it.
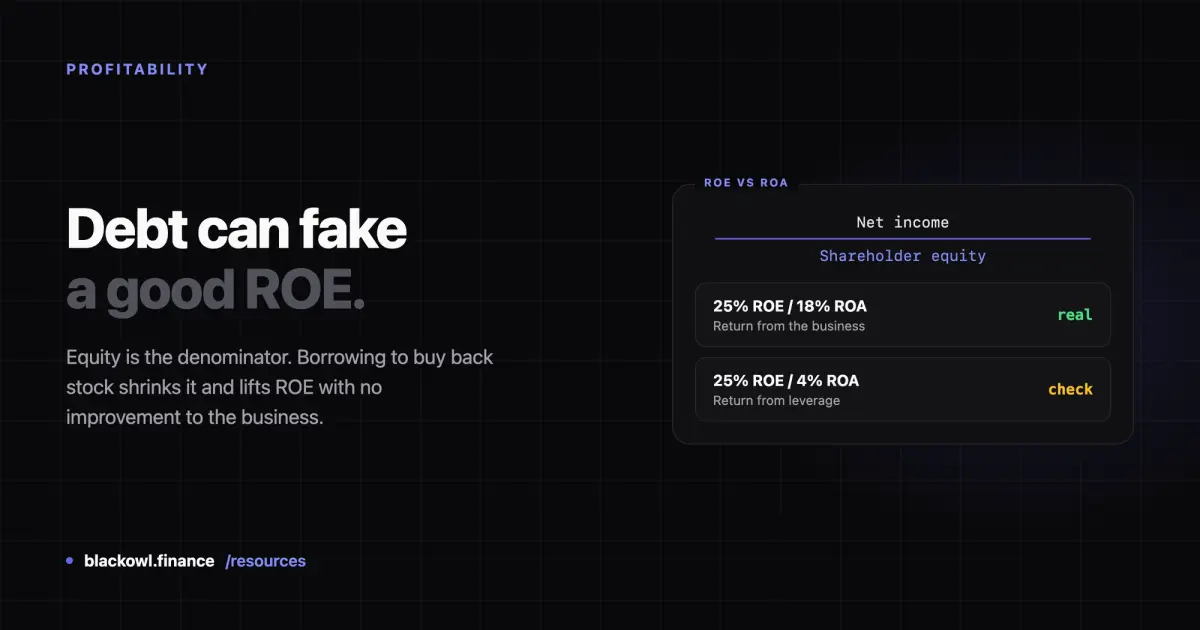
Return on equity (ROE) measures how much profit a company generates for every dollar of shareholder capital. A company earning $150 million on $1 billion of equity has an ROE of 15%. As a general benchmark, 15–20% is considered good for US large-caps, and consistently above 20% is strong.
The critical caveat comes early here: debt inflates ROE. A company can raise the number without becoming any better at its business, which is why ROE should never be read alone.
How ROE is calculated
ROE = Net income ÷ Shareholder equity
Shareholder equity is total assets minus total liabilities — the book value of what owners actually own. Both figures come from the financial statements.
A worked example. A company earns $150 million with $1 billion of equity:
$150,000,000 ÷ $1,000,000,000 = 15% ROE
Some analysts use average equity across the year rather than the year-end figure, which matters for companies that issued or bought back a lot of stock. As with every other metric here, check the convention before comparing across sources.
ROE, ROA and ROI
Blackowl's Key Statistics shows three return measures, and they answer different questions:
| Measure | Denominator | What it asks |
|---|---|---|
| ROE | Shareholder equity | Return on what owners put in |
| ROA | Total assets | Return on everything the business uses |
| ROI | Invested capital | Return on all capital, debt included |
The gap between ROE and ROA is the leverage tell. ROA counts assets funded by debt; ROE does not. A company with 25% ROE and 4% ROA is producing that return largely on borrowed money. One with 25% ROE and 18% ROA is producing it from the business.
What is a good ROE?
| ROE | Typical reading |
|---|---|
| Below 10% | Weak — capital is not working hard |
| 10–15% | Adequate |
| 15–20% | Good — the usual benchmark |
| Above 20% | Strong, if it is sustained and not leverage-driven |
| Above 40% | Investigate. Often buybacks, debt or a distorted equity base |
Sector matters as much as it does for profit margins. Software and consumer brands run structurally high ROE because they need few assets. Utilities and heavy industry run lower because they must fund enormous asset bases. Comparing across those groups tells you little.
The trend beats the level. ROE holding above 15% for a decade says far more than one excellent year, which may reflect a one-off gain rather than the business.
Where ROE misleads
This metric has more failure modes than most, and they all run in the same direction — flattering.
Debt inflates it. Equity is the denominator. Borrowing to buy back stock shrinks equity and raises ROE with no operational improvement whatsoever. This is the single most important thing to know about the number. Always read ROE beside the debt load and ROA.
Buybacks shrink the denominator. The same mechanism as with EPS, and it compounds: buybacks reduce equity directly, so sustained repurchases can lift ROE for years while the underlying business is flat.
Write-downs create absurd ROE. A large impairment reduces equity. The following year's ROE can look spectacular precisely because the company destroyed capital.
Negative equity breaks it entirely. Companies with heavy buybacks or accumulated losses can carry negative shareholder equity, which makes ROE meaningless or bizarrely negative. Screeners usually blank it.
It ignores what you pay. A company can have superb ROE and still be a poor investment at the wrong P/E ratio. ROE describes the business, not the price of the shares.
Accounting equity is not market value. Book value reflects historical cost. For asset-light businesses whose value is brand or software, equity can be small enough to make ROE look extraordinary.
How to read it properly
- Check ROE alongside ROA. A wide gap means leverage.
- Check the debt level directly — ROE says nothing about it.
- Look at five years, not one.
- Compare within the sector.
- Confirm the earnings are real with free cash flow.
That sequence is a specific case of the broader order in how to research stocks — establish the business, then the profit, then whether it is real, then the price.
See ROE on real companies
Key Statistics on each stock page shows ROE, ROA and ROI together:
Read ROE against ROA on the same page. Where ROE is far higher, the difference is leverage — and that is exactly the check this metric requires.
Sources
- U.S. SEC (investor.gov) — Stocks: how investors earn returns
- FINRA — Stocks
Frequently asked questions
What is a good ROE percentage?
For US large-caps, 15–20% is the usual benchmark for a good return on equity, and sustained figures above 20% are strong. Sector matters: asset-light businesses like software structurally run higher, while utilities and heavy industry run lower because they must fund large asset bases. Compare a company to its own history and its direct competitors rather than to a single market-wide number.
Can ROE be too high?
Yes. An ROE above roughly 40% deserves investigation rather than admiration. It often reflects debt shrinking the equity base, sustained buybacks, or a write-down that destroyed capital — none of which mean the business improved. Compare ROE against ROA: a wide gap between them is the signal that leverage, not operations, is producing the return.
What is the difference between ROE and ROA?
ROE divides profit by shareholder equity, so it measures the return on what owners contributed. ROA divides the same profit by total assets, which includes everything funded by debt. Because ROE ignores borrowed money and ROA does not, the gap between the two shows how much leverage the company is using. A 25% ROE alongside a 4% ROA is a debt-driven return.
Related Articles
What Is a Good Profit Margin?
A good profit margin depends almost entirely on the industry. The three margins that matter, typical ranges, and what they reveal.
What Is Free Cash Flow?
Free cash flow is the cash a business generates after paying to maintain and grow its asset base. Why it is harder to fake than earnings.
How to Research Stocks
A practical order for researching a stock: what the business does, whether it makes money, whether the profit is real, and what you are paying for it.
Invest Smarter with Blackowl
Blackowl is your AI-powered financial copilot, helping you track, analyze, and optimize your investments with ease.
- AI-powered insights
- Portfolio tracking
- Dividend management
- Performance analytics